I have used the data for 13 HWP cycles for the northwest dither position for DR21 Main. This includes file numbers 033064 - 095, 033113 - 124, and 033129 - 136. In these files the parallactic and zenith angles vary by 45 and 9 degrees, respectively; the airmass varies from 1.176 to 1.084; and τ225 varies from 0.068 to 0.081.
I have compared a calibrated SHARC-II map of this region of DR21 with the SHARP image and use a conversion factor of 826 Jy per SHARC data unit into a 4.6'' x 4.6'' pixel.
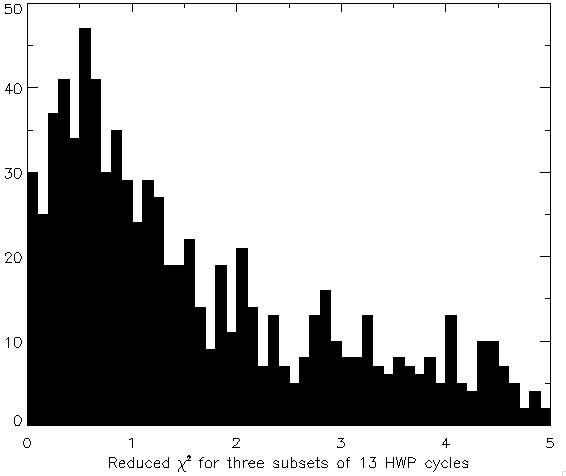
From this data I created a map of σP by propagating the errors on the q and u reduced Stokes parameters. To ensure that these errors were reasonable I ran sharp_combine on three subsets of the 13 files (the subsets contained 4, 4, and 5 HWP cycles) and compared the variation in polarization between the 3 subsets with the errors. The resulting χ2 are shown in the histogram below. The peak at ~0.5 may suggest that the errors are overestimated by about a factor of sqrt(2). However, the median occurs at 1.6 with a standard deviation of 3.1.
The SHARP specification table states that we should achieve
σP < 1% in 5 hours of integation for a source with a
total intensity of I = 0.46 Jy per 4.6'' x 4.6'' pixel. This can be
written as
0.01 = σP (I / 0.46) (tobs / 5)1/2
where tobs is the total observing time in hours.
This is for weather conditions given by τ225 = 0.05 and
an airmass of 1.3 (ZA ~ 40 degrees).
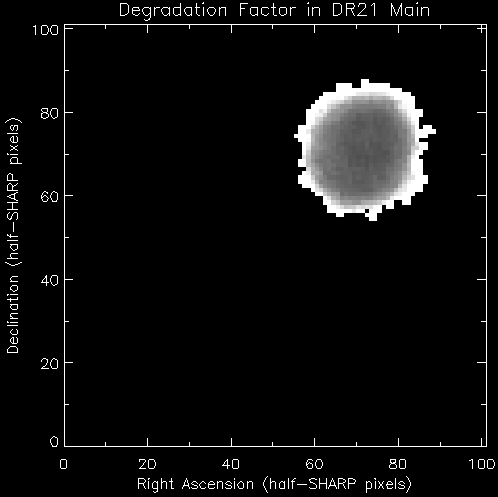
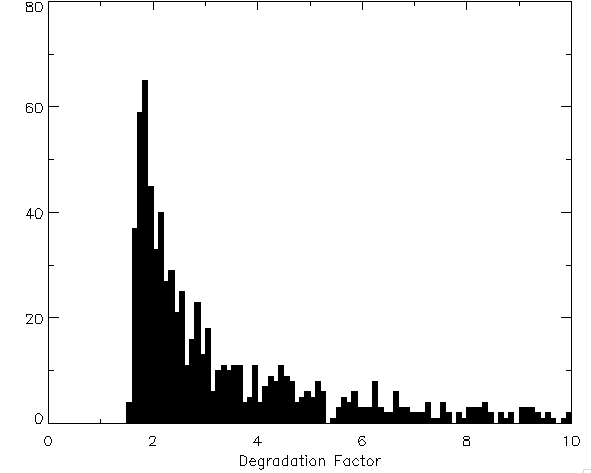
We compare the actual uncertiainties achieved to this estimate by
calculating the "degradation factor" DF:
DF = (σP / 0.01) (I / 0.46)
(tobs / 5)1/2 exp[-25
(τ225 sec z - 0.05*1.3)]
To determine this
factor for DR21 we use the σP and relative intensity
(scaled to Jy/pixel using the number above) calculated from the 13 HWP
cycles and an integration time of 90 seconds per file (90*4*13 = 1.3
hours). I used an average opacity of τ225 ~ 0.074 and
airmass = 1.13 (note that it is more correct to average the entire
exponential attenuation term, but this is a small effect). This
factor is shown in the map and histogram below.
 |
 |