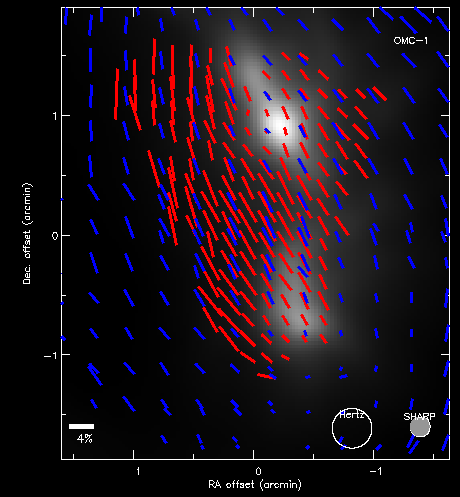
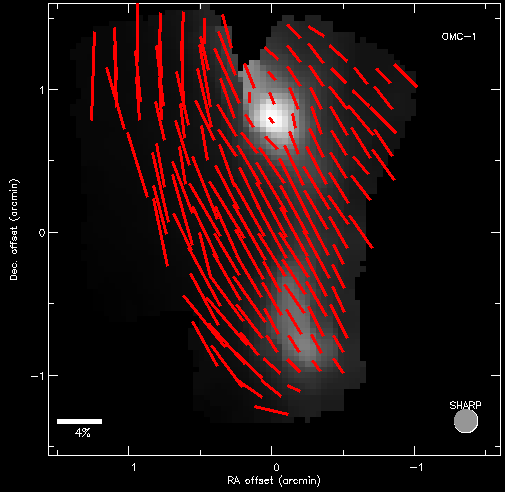
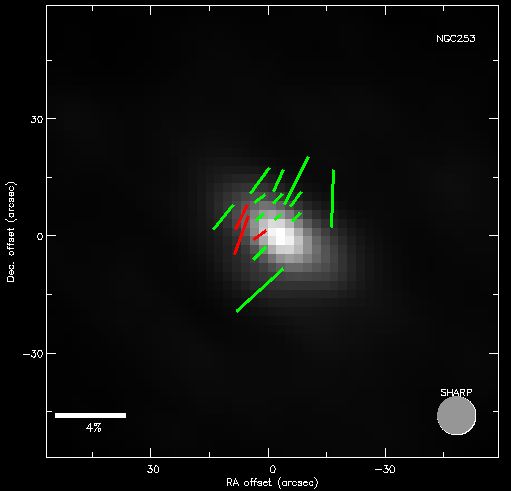
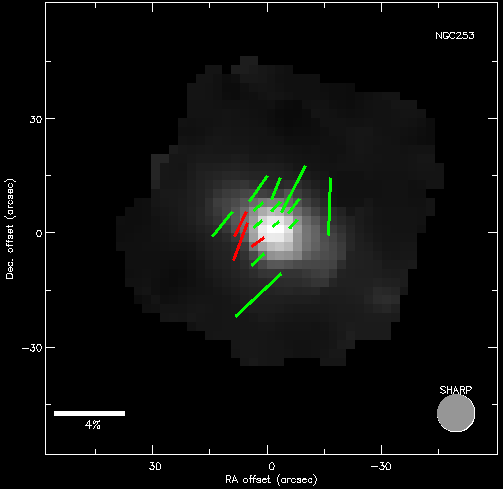
450 micron observations in Dec. 2006


Figures above --- pointing corrections from Darren's model applied, smoothed tau from Darren, no IP corrections
Left: SHARC-II flux map, red 3σ SHARP vectors, and blue 3σ Hertz vectors.
Right: SHARP flux map, red 3σ SHARP vectors


Figures above --- pointing corrections from Darren's model applied, smoothed tau from Darren, July 2006 IP corrections, red 3σ SHARP vectors, and green 2σ vectors
Left: SHARC-II flux map
Right: SHARP flux map
Last updated by John Vaillancourt. 2007-Jan-15
Return to SHARP analysis logbook.
Return to SHARP home page.


