Analysis of W3 data
This page describes the analysis and results from SHARP
observations of the W3 molecular cloud at 350 μm (July 2008) and
450 μm (January 2009).
Pointing
- July 2008: A poiniting model was fit using observations of
Uranus, CAL_CRL618, W3IRS5, and CAL_OCETI. The residuals w.r.t the W3
observations were usually less than 2.5 arcsec so this model was used
for all files. Details can be found in
this excel file.
- January 2009: The pointing model based on specific pointing
sources had residuals as high as 5 arcec when applied to the W3 data.
Therefore, I used the center of W3IRS5 as a pointing source and
interpolated those measurements (linearly with time) to estimate the
pointing for positions away from W3IRS5. Pointing details can be
found in
this excel file in the tab "pointing_2009jan. w3only".
HWP angle
Smoothed Tau
- July 2008: Used sharctau utility, run on zamin. See script at zamin.astro.uwo.ca:~sharp/Runs/2008july/process/w3/dotau. Results are tabulated in file list_all in that same directory.
- January 2009: Used sharctau utility, run on zamin. See script at zamin.astro.uwo.ca:~johnv/SHARP/2009jan/process/w3irs5/dotau. Results are tabulated in file list.all in that same directory.
RGM
- July 2008: Uses scan-mode data of objects Uranus, CAL_W3OH,
CAL_CRL618, CAL_OCETI, Arp220, and W3IRS5.
Details are online and at zamin.astro.uwo.ca:~johnv/SHARP/2008jul/calibs/rgm/README.
- January 2009: Uses scan-mode data of objects CAL_W3OH,
CAL_CRL618, L1527, and W3IRS5.
Details are online and at zamin.astro.uwo.ca:~johnv/SHARP/2009jan/calibs/rgm/README.
Instrument Polarization
- July 2008: TBD
- January 2009: TBD
Reduced-chi-squared Analysis
- July 2008: TBD
- January 2009: TBD
Maps & map Description
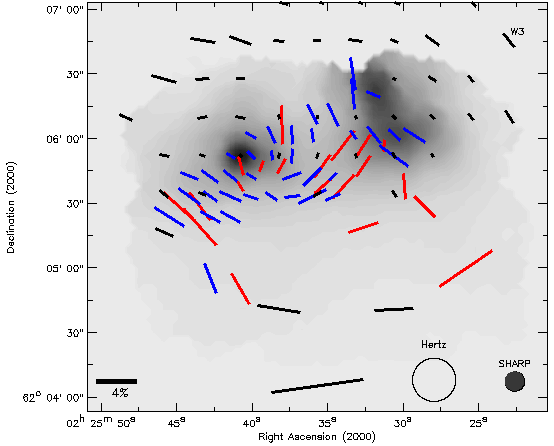
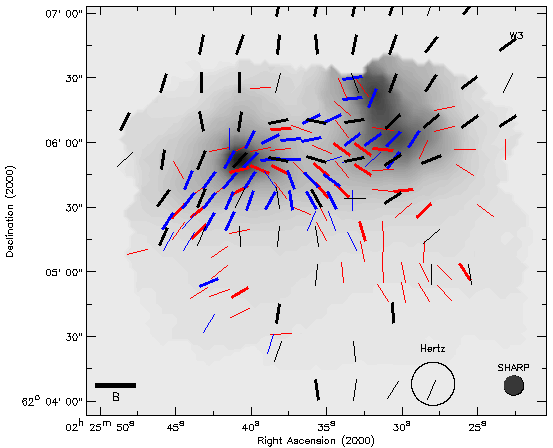
Maps below have been de-biased, and corrected for the polarization
efficiency (93% for SHARP at 350 μm; 98% for SHARP at 450 μm).
Black vectors = Hertz; Red vectors = SHARP 450 μm; Blue
vectors = SHARP 350 μm. Gray scale is from SHARP 450 μm. After
de-biasing the thin vectors satisfy P > 3σp; thick
vectors satisfy 2σp <= P < 3σp (thin
vectors are shown only in the B-vector plot). No instrument
polarization has yet been applied. No reduced-χ2
analysis has yet been performed.
 E-vectors.
 Constant length B-vectors.
Last updated by John Vaillancourt. 2009-Apr-17.
Return to Run-by-Run list.
Return to SHARP home page.
 E-vectors.
 Constant length B-vectors.
 E-vectors.
 Constant length B-vectors.