sharp_combine has now been updated to provide output map files of a reduced-χ2 statistic (use the -ch command line option). The value of the reduced-χ2 is calculated as given in my memo of 2009-Apr-09. The ouptut is automatically written to a file called chi2.fits. Note that this will be overwritten each time the code is run, so you will have to move this output to a new filename if you want to keep that data file.
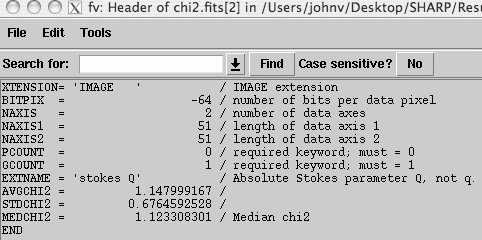
Four reduced-χ2 maps are written to this one file, one each for "smoothed-I", "unsmoothed-I", "Q", and "U", where the different I-maps refer to the different sized smoothing kernels used. Within each HDU are written keywords with the average (AVGCHI2), median (MEDCHI2), and standard deviation (STDCHI2) of the reduced-χ2 value across the maps. These values are also output to the screen when sharp_combine is run.
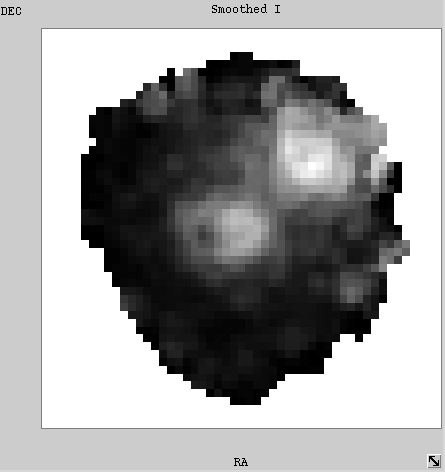
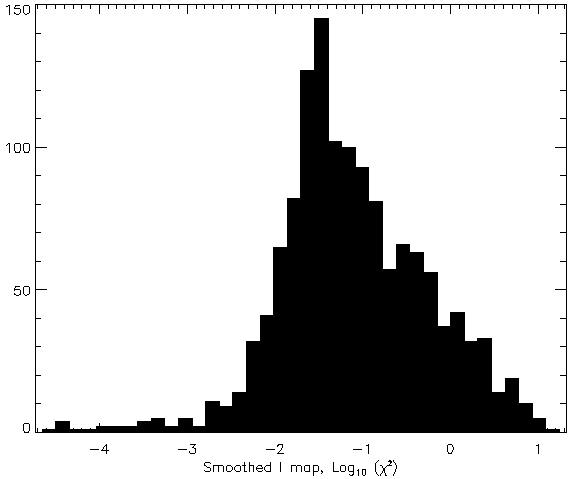
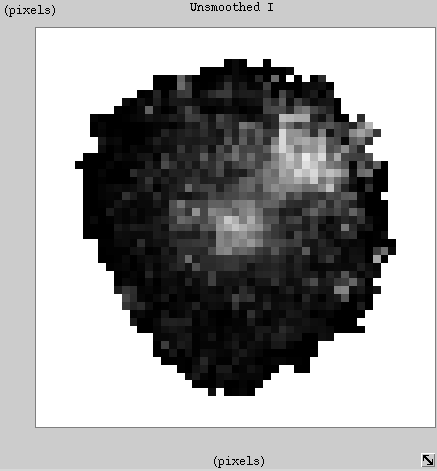
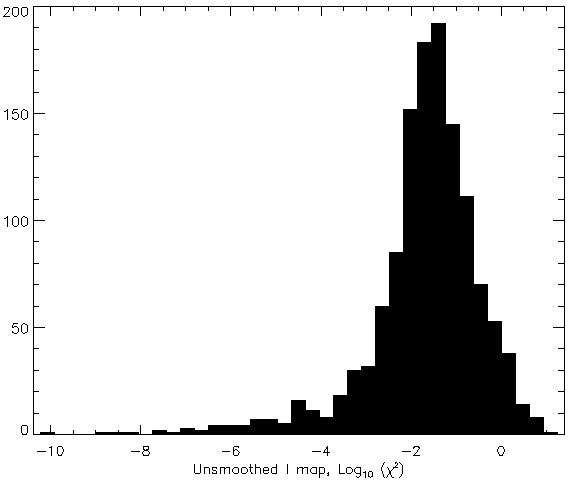
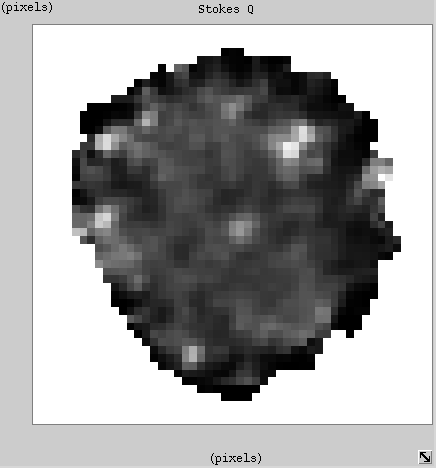
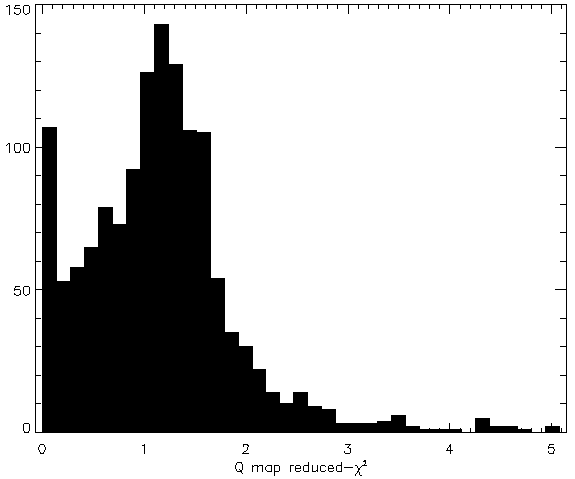
Below are some screen captures of the output headers and reduced-χ2 maps from NGC1333 (Sept. 2008), using the first 50 of 110 total data files.

Note that the gray-scale images below are logarithmic for the I maps (smoothed range = 0 -- 14.7, unsmoothed range = 0 -- 11.2) and linear for the Q (0 -- 5.1) and U (0 -- 7.8) maps.
 |  |
 |  |
 |  |
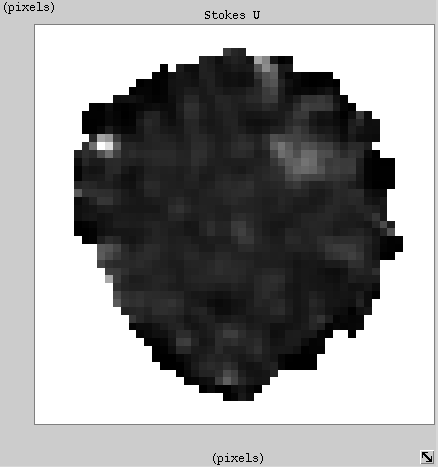 | 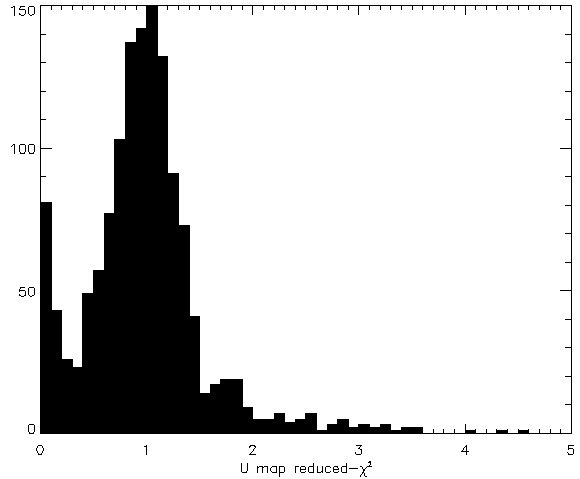 |
As can be seen from the histograms of the reduced-χ2 above, the Q and U values are reasonable with values ~ 1. However, from the maps you can see that χ2 tends to be larger towards regions where the source is located.
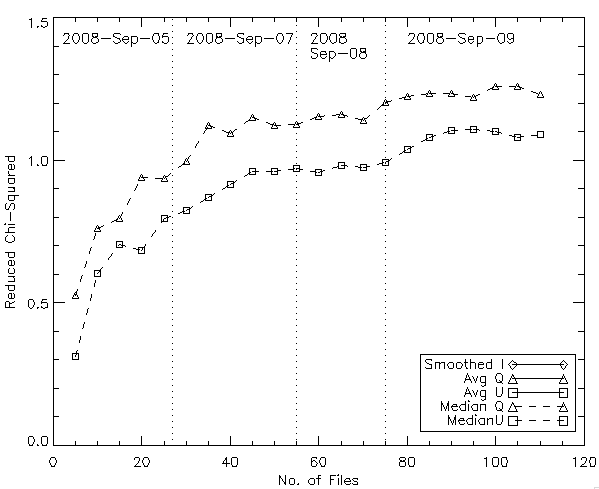
We wish to determine if there are uncertainties which enter the data on timescales longer than a single data file integration. To test this I looked for a time variation in the χ2 estimate. The plot below shows the median reduced-χ2 for the Q and U maps as a function of the number of data files which are used in the analysis. Note that the x-axis is the cumulative number of files, not a "bin" number.
