HWP Zero Angle and Polarization Efficiency at 450 μm
For the December 2007 observing run we measured the HWP zero angle
with two wire grids in parallel and a differential measurement with a
cold and warm load. We used the 450 μm HWP and filter and HWP for these
tests. The optical path was
- cold/warm load → aperture → 2 grids perpendicular to
path → SHARP → 1/16 in. nylon → SHARC-II
The differential measurement was undertaken by "leveling the hardware"
of the SHARC-2 camera with the warm load (a piece of eccosorb) and in
front of the aperture and then recording data with the cold load. The
leveling procedure was repeated each time the HWP was moved.
Slightly revised data analysis
Complete details of the older data analysis can be found in my
document
on the July 2006 polarization efficiency measurements. The
present anlaysis is only slightly revised in that it uses
Darren's sharcslice code to reduce the raw SHARC-II data. An
IDL code written by myself (poleff3.pro) then calculates the
polarization given the H and V array offsets. Previous analyses used a
modified version of sharcsolve where the polarization was
calculated in the C code rather than IDL. The old version
did not account for sub-pixel offsets in the H and V arrays. The new
IDL code accounts for this offset and calculates a weighted average of
the near-center pixels (based on the distance from center and a
gaussian with 1-pixel σ, as opposed to simply averaging the 4
center pixels. The center location was carefully measured
using fitgauss.
I find this new analsis to be more robust and to always return higher
polarization efficiencies with the current data set. This is likely a
more accurate estimate of the instrument optics polarization
efficiency. Although the practical efficiency may be lower if the H/V
array offsets are not accurately reflected in the full data analysis
(but the H-V alignment for this run was good to within 0.3 pixels).
Fit Results
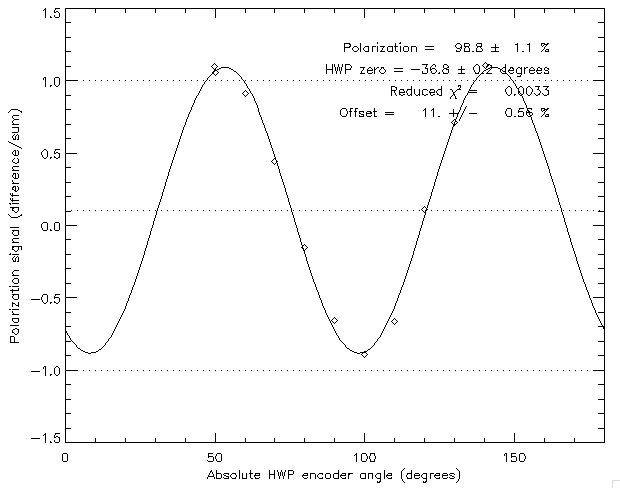
The measurement were done 3 times, twice with the grid wires
vertical, and once with the wires horizontal. The grid leveling was
good to less than 0.5°. You can also see notes
on measuring the centroids and fitting results for all 3
measurements. The fits under the "Sliced" heading refer to the
new analysis, "Psig" to the old analysis.
The mean of all 3 measurements is P = 99 ± 1
%, δ = -36.9° = 53.1° ± 0.1°. The
uncertainties reported here (but not in the figure) are estimated by
fitting two subsets of the data, each with half the data points.
 .
.
Using a value of δ=-36.9°=53.1° (measured from the
vertical) from the above data we find
V_null_encoder = 53.1°.
V_null_rel = 53.1 - 50 = 3.1°
HWP zero angle = 2 × 3.1 = 6°
Last updated by John Vaillancourt. 2008-Feb-6.
Return to SHARP analysis logbook.
Return to SHARP home page.
 .
. .
.