The program divides the source spectrum and the blackbody curves into 400 bins with logarithmic intervals of .01 between the wavelengths of .1 and 1000 micrometers. The program calculates the area of the source spectrum and the blackbody curves and stores the data in arrays (as well as outputting the data in files). The program then runs the arrays through all the filters multiplying each data point by the corresponding transmission for each bin and filter. Currently the program uses a rough model in order to test its efficacy and to check for errors. In the future, the source spectrum and transmission curves for the filters will be more accurate.
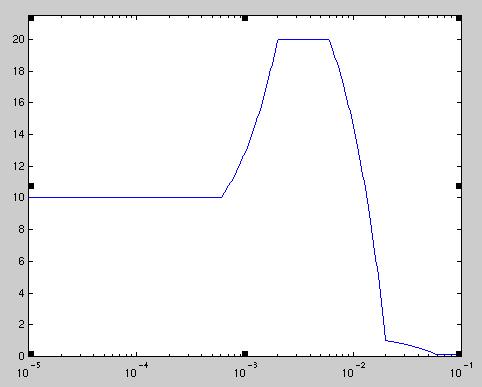
Presently the program uses a rough model of the source spectrum, based on rough estimates of the relative intensity of the source for each wavelength. (logarithmic scale without units)
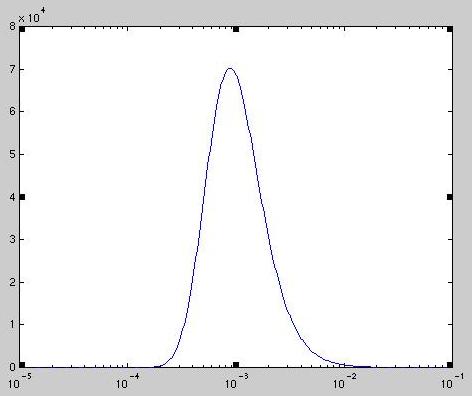
For the blackbody curves I used Bode's equation (which is more accurate than Simpson's which is probably overkill) to integrate the area of the curve. The blackbody curves for both the 100K and 300K filter are almost identical (except for size) so I'm just showing the 300K blackbody.
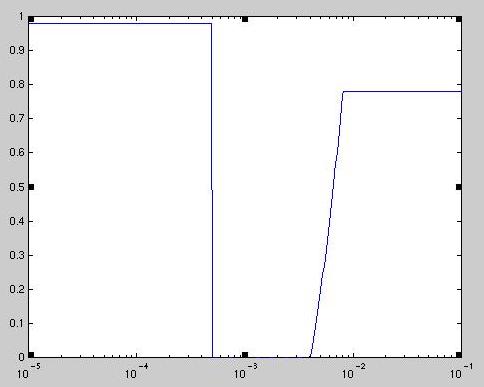
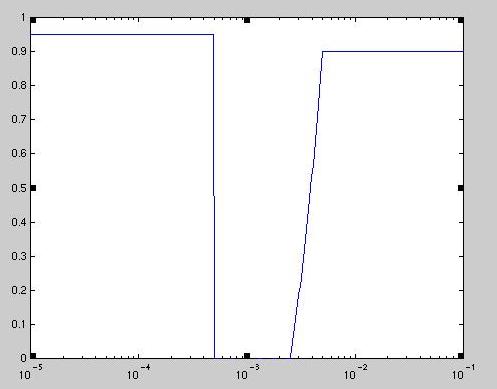
For both the 300K and 100K filter I made a rough model of the transmission of 1mm quartz at each temperature. Based on my research the models may need to be revised, because quartz seems to have varying transmission curves (probably due to random impurities) as well as the fact that we will probably use thicker pressure windows. The transmission curves are rather similar, but the 100K curve has higher transmissions due to the lower temperature of the quartz.
The 300K transmission curve:
The 100K transmission curve:
The program is designed to output the throughput of the telescope using models of the transmission curve of anywhere between one and four filters (and could allow for more filters). Once data on prospective filters is obtained they can be entered into the program for testing and comparison. For the purposes of testing, I used a model of a filter with transmission leaks of T every Nth (logarithmic) bin.
I have included the outputs of two trials:
test run using no leaks
a filter with transmission leaks of 1% every fifth bin
Last updated September 7, 2000