The first graph shows the declination tilt based on median filtered data
for RCW 57, taken March 20-21, 2000. The best fit to a sinusoid gives an
amplitude of 2.4' peak-to-peak for the tilt of the base.
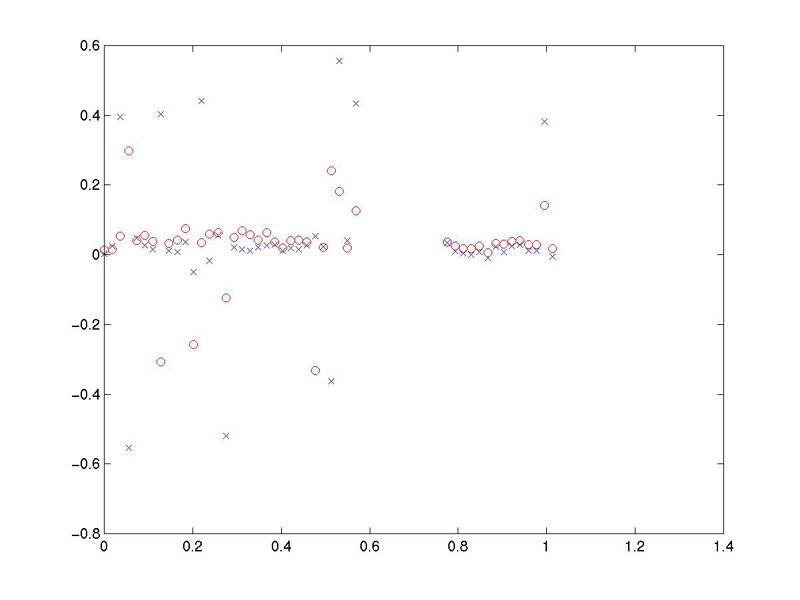
The second graph shows the pointing offsets for all 46 RCW 57 scans from
the 20th and 21st. The x axis is days from March 20.2, and the y axis is
the pointing offset in degrees. The blue "x" points are RA offsets, the red circles are dec offsets. It should be noted that the high RA points are
detections of the nearby source NGC 3603 (which is typically somewhat fainter
than RCW 57 but due to bad-signal to noise or transmission variations will
sometimes be selected by the fitting program as the brighter source).
NGC 3603 is about 0.4 real degrees towards the East from RCW 57.
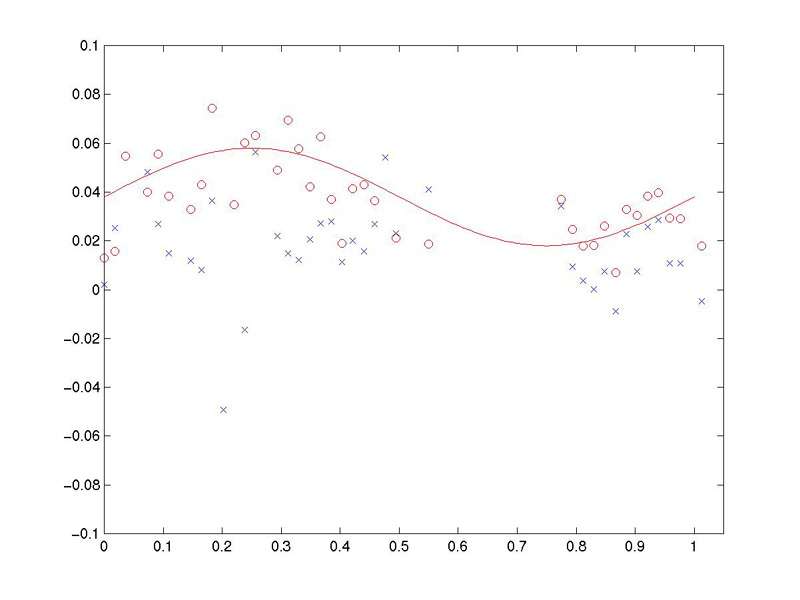
The third graph has all outlying data points removed, and a 0.04 degree
amplitude tilt has been drawn in red. This is not a fit curve, and close
inspection reveals a slight phase mismatch between the drawn curve and the
phase suggested by the raw data.