Using the same methodology as the photometry data, it is possible to calibrate the photometry data extracted from the polarimetry files. Convincingly, the slope, or X, for the polarimetry photometry data is 1.02 +/- .003. The reason for the small standard deviation is extremely low noise levels for polarimetry files.
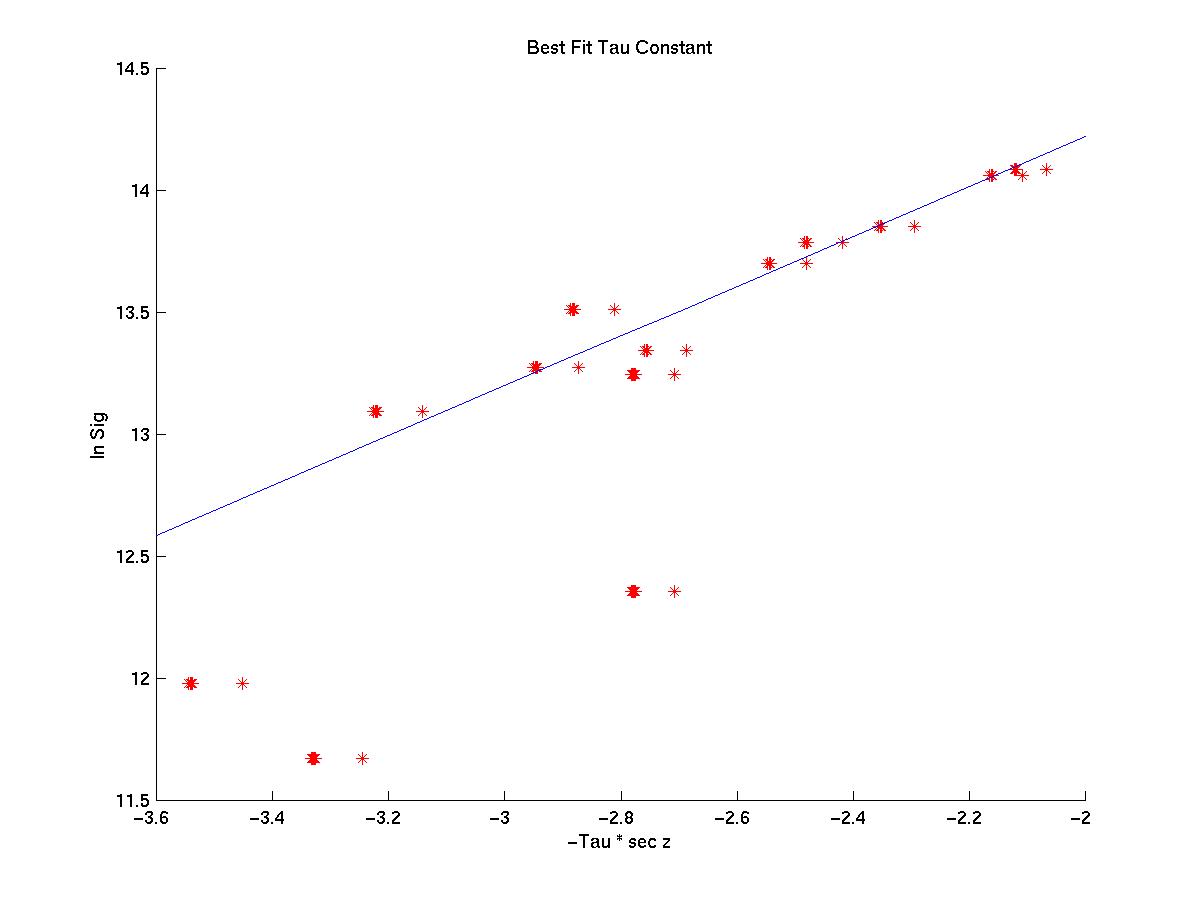
The following is a graph of the best-fit line.
However, what is disconcerting is that the y-intercept, 16.26 as opposed to 16.89, is significantly different. This means that the calibration constant Y for the polarimetry is significantly lower, about half the photometry data. This also means that the signal is on average about half that of the photometry data. Plotting SY vs. time, we can see that the variations from the best fit line range from very close to appoximately 6 * 10^6. This is similar to the photometry data.

Quite possibly this is a programming error, but what exactly is going on with the signal still needs to be researched.