The power incident was 1260 pW. This was based on considering the power emitted
by a 300K blackbody that the light cones can absorb, given their 3.05 mm diameter
and f/3.5 aperture. The passband is ~ 10% of the central value of 450 microns,
which translates to a passband of 6.67*1010 Hz.
The error in power absorbed is taken to be 2 pW. This figure is arrived at based
on the uncertainty in lining up the P vs. R curve for closed blankoff wheel over
the P vs. R curve for open blankoff wheel. A sample is given below that demonstrates
this technique:
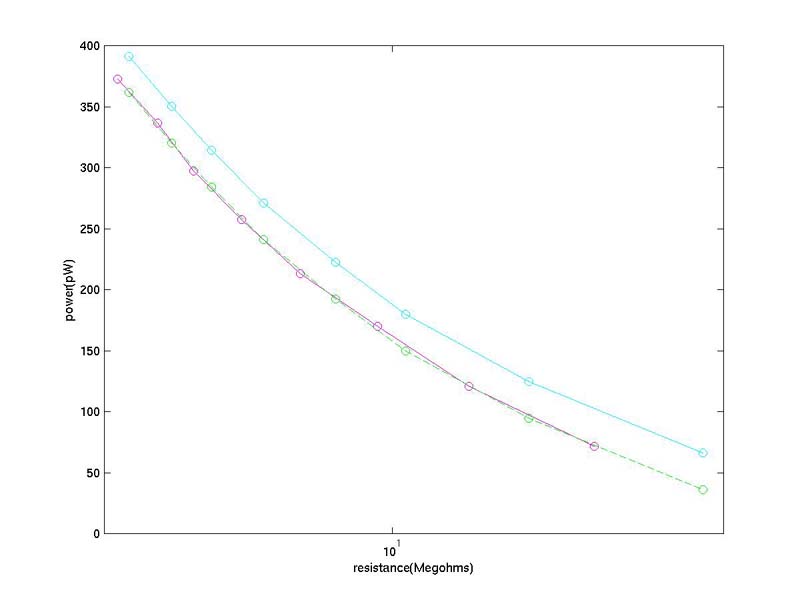
The cyan curve is the P vs. R curve for BOW closed. The magenta curve is P vs. R for
BOW open. The dashed green curve is the open-BOW P vs. R curve minus 25 pW from P.
A difference of a couple of pW in moving the open-BOW curve around is definitely
noticeable and correctable.
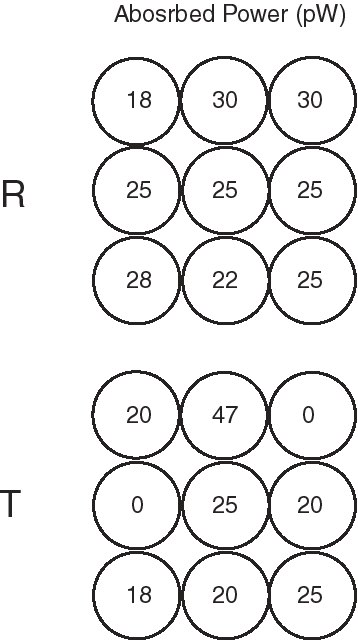
Also note that there are a few unusual pixels. Detector 1 in the R array is a little
lower than the other pixels in terms of power absorbed. This is due to the fact that
pixel 1 was broken in October, 1998, necessitating the use of a load curve from a
different run with different filtering inside dewar. T6 shows no power absorbed, but
it is unclear why this is so, as the detector seems to show a sensible relative gain
as shown by the relative gain matrix. T8 shows
a relatively high power absorbed, but it is again unclear exactly why, although it
should be noted that detectors T6 and T8 show lower closed-blankoff-wheel responsivities
than do other detectors. The error in power absorbed for the two unusual T-array
detectors can be considered anomalously high.